A deep dive into the console API
I will be honest with you. I debug almost all of my Javascript with a million and one console.log() calls. I haven’t been able to get very far into using a proper Javascript debugger system just yet, but I might not be alone. Brian Kernighan said:
The most effective debugging tool is still careful thought, coupled with judiciously placed print statements.
I’m running with this being relevant for me, even though Kernighan meant this in reference to Unix. Professional admissions aside, I have recently been looking deeper into the web console API I use for every web project I ever work on. It turns out there is a lot more than just console.log() in there. So here is a breakdown of some other methods and techniques you can use with the API to make your development and debugging life a little easier:
- Assert, then log
- Computed property names
- Displaying data as a table
- Grouping messages
- Styling messages
- Timing executions
- Returning traces
- Better object logging
As always, it’s good to check up on the browser support for some of these as some are non-standard, before using these in anything resembling production. I’ve also put links in each section linking to the individual features, so you don’t have to battle with the overall console API comparability table. On with the show!
Assert, then log
We shall kick things off with a nice quick method which is console.assert(). This method outputs a message if the first parameter resolves to false, and nothing if it resolves to true. Useful for conditionally logging something based on a variable. For example:
console.assert(false, "We have resolved to false.");
// Outputs: We have resolved to false.

console.assert(true, "We have resolved to true.");
// Void [Does not output anything.]
See the MDN Documentation for console.assert() for more.
Computed property names
Ever forgotten which variable is being logged? No more concatenating a label before the variable you want to output, try wrapping your variable in an object literal.
By doing this the console call will also display the name of the properties alongside their values, useful when you often want to see the name of a variable when outputting via a log message. You can do this with a single variable e.g: console.log({obj}) or outputting a number of things at once:
const foo = "Why, ";
const bar = "hello!";

console.log({ foo, bar });
// Outputs: Object { foo: "Why, ", bar: "hello!" }
You can see the variable names from the script have been carried over as the object literal properties, making them easier to read!
Variables as tables
With console.table() you can display your variable as a table! This works best on an arrays of things with similar properties between them very useful for looking at a number of similar variables in a small space. For example if we wanted to display some books in table:
const books = [
  {
    title: "Code: The Hidden Language of Computer Hardware and Software",
    author: "Charles Petzold",
  },
  {
    title: "Hacking : The Art of Exploitation, 2nd Edition",
    author: "Jon Erickson",
  },
  {
    title: "Don't Make Me Think",
    author: "Steve Krug",
  },
];

console.table(books, ["title", "author"]);
This would look something like this:
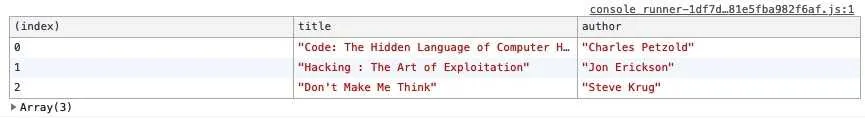 Example output of a console.table() running in Chrome.
See the MDN Documentation for console.table() for more.
Console groups
You can group a set of related console messages together with console.group(). This will nest the call messages between it’s opening and closing pair and then allow you to collapse them in the console.
The string argument in group() is used as the title of the group you can collapse. By default, these groups are open in the console panel. To close them by default, you can switch the group() with groupCollapsed() (keeping the groupEnd() the same). This will close the group allowing users to open them at their leisure. For example:
// Start by creating a group called 'My Group'.
console.group("My Group");

console.log("Hello foo");
console.log("World bar");

// Close the above group.
console.groupEnd();
See the MDN Documentation for console.group() for more.
Log styles
You may or may not know that you can use console.warn() and console.error() to throw associated styled messages to the console, alongside this you can also fully style messages with CSS. Using the %C token in a console message you can then provide CSS styling for the string immediately following the token:
console.log("%c Hello World", "background: orange");You can expand this to use multiple styling tokens (%c) in tandem to style multiple blocks together. Here is an example that has two styling blocks, each of these rule sets apply to the string after them.
console.log(
  "%c Hello World  %c Again ",
  "background: red",
  "background: blue; color: white"
);
Timestamps
For logging execution time of a script you can use the various time based methods of the console API. These are made up of setting up timers, reading them and once you’re finished, ending them. These can be used by simply creating a timer by doing the following:
console.time("foo");The string argument for the time() method creates a timer from the point this line is executed and then is referenced when wanting to do something else with the same timer. To end the timer you call:
console.timeEnd("foo");In the meantime before ending the timer you can call timeLog() to log the current time duration for that timer. E.g.
console.timeLog("foo");I’ve set up a demo CodePen that uses a setTimeout and a setInterval to showcase these features that you can see here: https://codepen.io/jamesrwilliams/pen/WmepWv
There is also the timeStamp() method which is an experimental feature at the time of writing. This lets you add markers to the browsers’ performance metrics, allowing you to mark a point in your execution with others like layout and paint events. Read more on the MDN docs about console.timeStamp().
Stacktraces
You can also generate a stack trace with the console API. This will show you the call path taken to reach the point at which you call console.trace(). Useful for looking at what called your methods/functions. For example:
function foo() {
  function bar() {
    console.trace();
  }
  bar();
}
foo();
This would log something like this to your browser console:
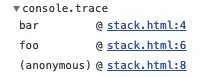 Example output of a console.trace() running in Chrome.
console.dir()
console.dir(foo);This console method outputs a nice user-friendly version of things like objects and arrays. Now I thought, “hey this is super like console.log, right?”. Turns out to a certain degree it is but there are some differences as occasionally log() will return a string representation of the variable, dir() will always return an interactive version.
For example when logging regex strings console.log prints just the regex string whereas console.dir spits out its properties, things like flags also. Another note is that console.dir keeps a reference to the object, as such, you probably don’t want to use it extensively in production.
I’ve put together a little demo of the differences between dir() and log() for my own understanding that you can check out here: https://codepen.io/jamesrwilliams/pen/eXOJoW.
Profiling
You can even start recording a performance profile via profile(). To end a profile recording you can call profileEnd(). You can also give the profile a name by passing .profile() a string argument. Be warned though, this is a non-standard feature and is on the bleeding edge of the API, with implementations in most modern browsers apart from Safari and Opera (at the time of writing) find out more here: https://developer.mozilla.org/en-US/docs/Web/API/Console/profile.
Conclusion
The console API is a staple of a developers’ life, and I think these alternatives to the regular log() are a great addition to any workflow, especially if you can remember to use them!
I’ve set up a CodePen collection of a few demos, showing off these features that can be found here: https://codepen.io/collection/XpwWPL/